

Page to be updated with new data from the trip.
You can’t wait for inspiration. You have to go after it with a club.
Jack London
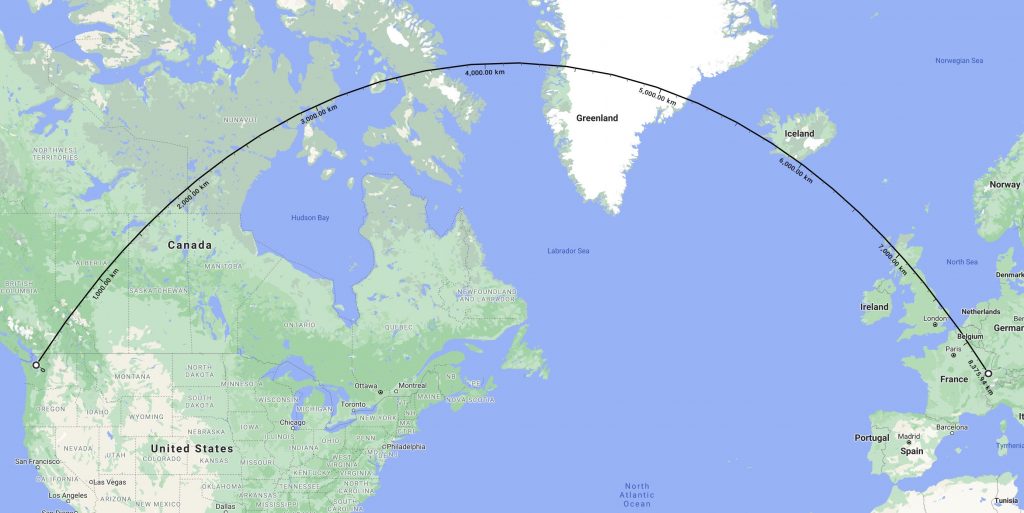
Early in 2020, I committed to bring a boat across the Atlantic. The opportunity and the fact that crew is needed, in addition to see family after some health issues, pushed me to take the risk to fly back to the old continent. At the time of this article (early October 2020), both Seattle, WA, and Switzerland have a low contagion rate (around 60 cases per 100,000 over the last two weeks). However, my flights brought me in transit to Amsterdam – which has a much higher rate at 189. All test at about the same rate. Due to the current travel bans between the United States and Europe (to which I am not subject to due to my nationality and resident permit), the flights across the Atlantic were empty. However, the travel between Amsterdam and Switzerland was much more packed. I did the whole trip with N95 masks and face shields.
Quarantine in Switzerland
Section last update: October 4th , 2020
Switzerland requires a mandatory 10 days quarantine upon arrival (with phone follow-up). I am working remotely during that time and developed a tiny model based on past research about incubation period, people in close contact, and reduction measures such as masks and face shields.
This one is largely imprecise simply due to the nature of the data (and might be totally off), but it gives an estimate that does not seem outrageous, and the decay of the possibility to develop COVID-19 symptoms while in isolation is based on real studies.
First, the model computes the likelihood that the incubation period if positive is longer than the current quarantine time. Then, it also takes into account the number of close contacts, the possibility that those contacts are positive and contagious (modelled by a two weeks window rate per 100,000 people), a possibility of increase due to a higher contagion trend (reproduction number estimates, R0), and a possible percent of contact reduction thanks to protective measures such as masks and screening.
Incubation mean of 5.8 days, 95% confidence at [5.0; 6.7] days with a 95th percentile at 11.7 days [9.7; 14.2], [source]. Estimates are through Log Normal CDF function, shown to model incubation [source]. Rate per 100,000 is an average from Netherlands (189) [source], Switzerland (60) [source], King County, USA (55) [source] at the time of the trip. Estimates with R0 of 1.1 [source]. 32 close contacts is an estimate of the number of contacts right before (13) and during the trip (20). Transmission rate in close contact is estimated at 12.7% with an observed bracket of [8.1%; 17.3%] depending on the study [source], with a reduction of 82% with a 95% confidence at [61%; 91%] in case of wearing a mask or other protective measures [source].
Estimates does not take into account the time at which people tend to become contagious.
Finally, this model may be wrong.
My travel origin and destination having relatively low cases in comparison to other places, my risk is relatively limited.
Notes on the Model
Section last update: October 6th , 2020
Incubation Likelihood
The study we are using to compute the likelihood of being contagious after days in isolation is based on an aggregate research from different sources, and demonstrates that the incubation rate can be modelled by a log-normal distribution (with a median of 5.1 days and the 95th percentile of 11.7). In other words, if someone has COVID-19, the chance of showing symptoms after 5.1 days is 50%, and only 5% after 11.7 days [source]. Thus, if you wait in quarantine for anything above 10 days, your chance of starting to show symptoms starts to be very low (see graph above). If we were to plot this, here is the graph that estimates when people start showing symptoms:
Note the long tail of the graph – this is typical of a log-normal distribution. Our model is however taking into account the 95% confidence intervals of the log normal parameters and uses a delta-method to compute upper and lower bounds (hence the confidence bracket).
Exposure Risks
This, however, does not give us the possibility that we have COVID-19. For this, we need to estimate the likelihood that we were in contact with someone contaminated. Available statistics tell us that we have a specific rate of new cases over two weeks over 100,000 people. This rate varies per region around the world and over time, and is thus usually computed over the last two weeks. Since two weeks roughly cover most of the incubation time (see graph above – most of the filled area are is before 14 days), and since symptoms tend to get gradually worse, it is rough but fair to estimate that that number represents a likelihood of an average citizen (taking average protective measure) to have the virus without being in quarantine – i.e. the population contagion rate.
Of course, this is a large simplification. Populations even in small areas tend to be static and see only a limited number of people, which means that spreads tend to be localized and the variance among population is likely much greater. Moreover, we can reduce risks by understanding what actions others take around us, as careful people with a small contact circle are much less likely to be infected. This is much more on the person herself or himself than on anything else – something we cannot approximate here.
While this work in principle, since that data is over the last two weeks, it is possible that the current number of contagious people would be different. Thankfully, we can estimate the reproduction number (R0), which tells us to how many people one contagious person usually transmits the virus to (usually nowadays, this occurs over the same two weeks until the person is in isolation as the symptoms are discovered, get worse, and a test is done). A R0 that is less than one means that the epidemy would eventually die off as one person tends to gives the disease to less than one other person on average, while if it is higher, it will spread.
Back in March, some estimates of R0 for COVID-19 were around 3 – 7. Nowadays, this is usually down to 0.9 – 1.5 depending on the region (but it is much higher in hot spots!). This is mostly thanks to social distancing and protective measures such as masks. We can thus use that number (i.e. the trend of R0 we are seeing in the data) to increase or decrease the possibility to meet someone with the virus based on the current contagion rate we described above.
Moreover, most people during travel take adequate protective measures such as wearing masks and staying at a distance. If we have close interaction with people while being careful (defined as less than 1.5 meter for more than 15 minutes) – and while they are careful – the possibility of direct disease transmission would be lower. This has an impact on the reproduction rate as discussed above, but we can also introduce a correction factor based on the immediate measures we take as an individual to reduce the possibility of getting the virus during transit (for instance, wearing N95 masks). There are various studies from which we can use the absolute effect as a mean to understand how likely we are to transmit or get the virus if we are taking precautions. However, those come from various diseases from the same family (MERS, SARS, COVID-19) and were mostly aiming at measuring the reduction factor of various protections, and thus were focusing on adjusted odd ratios drawn from experiments with or without masks or other reduction factors (see [source]):
- Masks. The worst of this pool of studies showed that, at most, 17.4% infection was generated from close proximity (less than one meter). Note that this is from a random set of people – not everyone has COVID-19 in it, so in itself that number does not represent the likelihood to get COVID-19 by standing close to a contagious person. However, wearing a mask reduces that absolute effect to 3.1% (with a confidence interval at 95% of [1.5%; 6.7%]), a 82% reduction (95% conf. at [61%; 91%]).
- Eye protection. Similarly, eye protections have been said to reduce an absolute effect of 16% to 5.5%, a 65% reduction, 95% (conf. at [47%; 77%].
- Social distancing. Moreover, social distancing also has a large effect. For this, we only consider a close (less than 1 meter) and “further” distance (more than 1 meter). As such, the reduction of absolute effect was from 12.8% to 2.6%, a 79% reduction (95% conf.: [59%; 90%]).
The reason for such large intervals is that the exposure time of those studies as well as the nature of their dataset provides only a low confidence.
Finally, being close to a contagious person does not directly translate into getting the virus, even without any masks and in proximity. Sadly, there is little studies available to understand the person-to-person transmission rate in case of high proximity, especially now since people tend to take appropriate measures to reduce risks. An early study from China based on a pool of 129 cases and 4,950 close contacts showed that the incidence is higher within households, with 10.2% transmission rate (13.0% with expectorations). Similarly, some study on the Hubei region found out an incidence of 14.9%. [source]. As this was before COVID-19 was widespread, those contacts were likely to exhibit a normal behavior at the time of the contagion. Due to lack of data, we will assume normal distribution and produce an average of 12.2% and a 95% confidence of [8.1%;17.3%] as transmission rate. Note that this might also varies depending on the region of the world you are in – as social behavior varies based on cultures.
All in all, this gives us the formula:
ContaminationLikelihood = 1 - (
   (1 - PopContagionRate
      * R0
      * (1 - ProtectMeasureReduction)
      * transmissionRate
   )
)ContactCount
This gives us the likelihood we were in contact with someone contaminated during our travel – and got the virus. Note that we can combine different sets of people with different contagion rates and protective measure to get a broader picture. However, every time we add one more population, the precision will get lower as we have more variable to factor in (many of those parameters come with 95% confidence intervals). For the case above, for instance, we used the population defined by the following data (in the format [95% (or > 95%) conf. min, average, 95% (or >95%) conf. max]) – note that this is a rough approximate only:
Friends - close contacts:
  cases per 100K: [55, 60, 65]
  population rate: [0.055%, 0.060%, 0.065%]
  r0: [1.0, 1.1, 1.5]
  reduction measures: [0%, 0%, 0%]
  count: [5; 5; 5]
  exposure: [0.022%, 0.042%, 0.084%])

Friends - outside, > 1m, windy:
  cases per 100K: [55, 60, 65]
  population rate: [0.055%, 0.060%, 0.065%]
  r0: [1.0, 1.1, 1.5]
  reduction measures: [59%, 79%, 90%]
  count: [7; 7; 7]
  exposure: [0.003%, 0.012%, 0.048%])

Seattle Airport and first flight:
  cases per 100K: [90, 100, 110]
  population rate: [0.090%, 0.100%, 0.110%]
  r0: [1.0, 1.1, 1.5]
  reduction measures: [61%, 82%, 91%]
  count: [4; 6; 8]
  exposure: [0.003%, 0.015%, 0.089%]

Amsterdam Airport and second flight:
  cases per 100K: [170, 189, 245]
  population rate: [0.170%, 0.189%, 0.245%]
  r0: [1.0, 1.1, 1.5]
  reduction measures: [61%, 82%, 91%]
  count: [8; 10; 12]
  exposure: [0.010%, 0.048%, 0.297%]

Zurich Airport, train home and station:
  cases per 100K: [55, 60, 80]
  population rate: [0.055%, 0.060%, 0.080%]
  r0: [1.0, 1.1, 1.5]
  reduction measures: [61%, 82%, 91%]
  count: [3; 5; 6]
  exposure: [0.001%, 0.008%, 0.049%]
There are a few interesting conclusion we can draw from such data:
- As an indication, is is important to keep our exposure lower than the population contagion rate. Based on the number of people we meet, this is not always possible. But by doing so, we ensure our exposure is lower than the overall exposure of the population, which could drive the numbers down going forward. Overall, this is the case for 2 out of 4 of our population above.
- The transit in Amsterdam represents the biggest uncertainty in terms of risks, followed by SeaTac airport, which is not a surprise. However, seeing some friends in close quarters (a choice I did willingly), also represent some risk potential.
We can now use that probability and the incubation period probability as computed above to get an estimate of the possibility we will develop symptoms in the future (and thus have COVID-19) depending on the time we spend in isolation:
LikelyhoodToGetCovid19(days) =
     ContaminationLikelihood
   * LikelihoodToDevelopAfter(days)
Confidence Interval Approximations
Note that we consider the incubation period parameter estimates to be independent, if not identically distributed. Roughly, since the two estimates of the log-normal distribution parameters μ and σ are considered independent (see [source]), we can use the delta-method to approximate the output of the confidence intervals.
Moreover, we have no idea of the quality of the data for our various contagion rate parameters (R0, cases per 100,000 people, etc.). We thus do a simplification to compute a window that is greater than 95% by simply multiplying the error boundaries (see an example of this here). This yields an interval that is too big to be the 95% confidence interval. It thus gives us a higher confidence bracket than 95%, but we are clueless about its precision.
Moving To La Rochelle
Section last update: October 21th , 2020
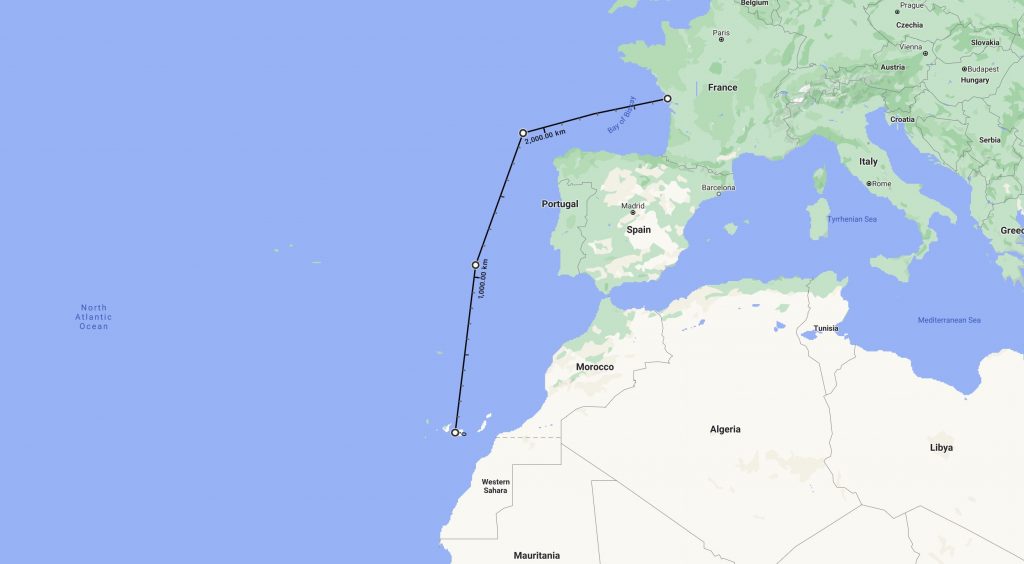
This section tracks the time until and after jumping on a Pogo 12.50, an offshore-ready sailboat. We can consider the time spent on the boat as quarantine. However, this definition starts to erode as we are forced to stop along the spannish coast due to bad weather. We use data from the WHO, reporting new cases per week over a million people, as a source of population contamination rate. Note that the European Union also maintain its own list. Switzerland has seen an increase, but France is at a much higher rate of 441. Note that Spain, of which the Canaries islands are part, is at 347. The data about the Canaries Islands is likely different, however, but I couldn’t find exact numbers. Due to a spike in cases in August, the local government said they would cover the cost of any COVID-19 cases within tourists groups.
For Geneva, from where most of the crew is, we now have a rate of 606 cases per 100,000 inhabitants (from less than 200 when I got to Europe, and 60 for overall Switzerland!). Switzerland is having a major surge with more than 20% of tests coming back positive, which shows that the pandemic is not under control at all. Besides, I believe I am, in the end, the only one who got tested properly before getting on the boat. Moreover, we had dinner with two other family members of one of the crew. I also stopped to see my grandmother on the way there, even if she does not represent a major risk. I also saw 3 friends before travelling. This translates into:
Crew:
  cases per 100K: [500, 606, 750]
  population rate: [0.50%, 0.61%, 0.75%]
  r0: [1.2, 1.5, 2.0]
  reduction measures: [0%, 0%, 0%]
  count: [7; 7; 7]

Friends before going on the boat:
  cases per 100K: [180, 200, 250]
  population rate: [0.18%, 0.2%, 0.25%]
  r0: [1.2, 1.5, 2.0]
  reduction measures: [0%, 0%, 0%]
  count: [3; 3; 3]
Time remaining before getting on the boat:
Note that the sailing crossing can be monitored here:
Landing on the Canary Islands
Section last update: November 5th , 2020
The canary islands have an infection rate that remains relatively low in comparison to the rest of the country, at 72 cases per 100,000 inhabitants over the last 14 days. However, as we made landfall, we were joined by three people coming from Geneva, Switzerland, which has a rate of 1,784 cases per 100,0000 inhabitants. While we were sailing, the cases in Switzerland spiked badly.
All in all, it is interesting to note how lucky we were: we escaped Switzerland before the spike, and a week later many of our friends got sick; we left the coast of Spain as the curfew became in effect, to reach an island with the lowest number of cases per day.
The Canary Islands now require a PCR test to be done before boarding. This wasn’t the case before; so we will assume the following from the three people that joined us:
Friends joining the crew:
  cases per 100K: [1784, 1784, 1784]
  population rate: [1.78%, 1.78%, 1.78%]
  r0: [1.5, 2.0, 2.5]
  reduction measures: [0%, 0%, 0%]
  count: [3; 3; 3]
With a landfall on November 2nd, this means:
Back To Seattle
Section last update: November 7th , 2020
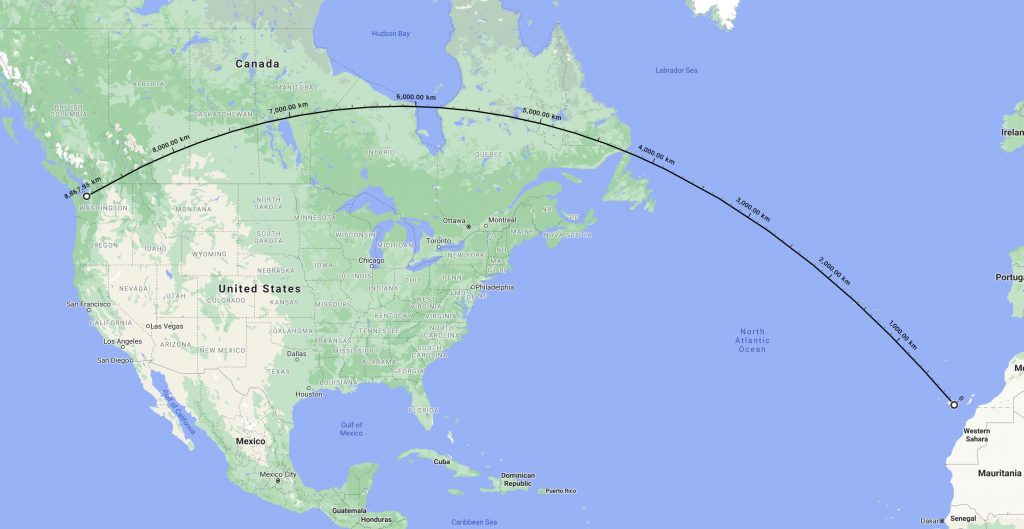
Flying back to Seattle after boat delivery is through Amsterdam, with a long layover and a night in a hotel. All in all, I was exposed to 3 people closely in the airplane, not much more (so far). Note that the canary island has a low rate, at 72 cases per 100,000. We will add a safety margin here as the airport is filled with tourists that may not have spent the required time on the island to assimilate to its exposure risk. We will also assume a R0 similar to Spain’s mainland. The Netherlands, on the other hand, has a contagion rate of 724 cases per 100,000 people.
Note that we report this cumulatively with the previous exposure in the Canary Islands as well.
Flight to Amsterdam:
  cases per 100K: [30, 72, 140]
  population rate: [0.03%, 0.072%, 0.14%]
  r0: [1.5, 2.0, 2.5]
  reduction measures: [61%, 82%, 91%]
  count: [5; 5; 5]

Amsterdam Airport and flight to Seattle:
   cases per 100K: [700, 724, 800]
   population rate: [0.7%, 0.72%, 0.8%]
   r0: [1.5, 2.0, 2.5]
   reduction measures: [61%, 82%, 91%]
   count: [5; 5; 5]

Seattle Uber Driver, airport contacts:
  cases per 100K: [120, 148, 180]
  population rate: [0.12%, 0.15%, 0.18%]
  r0: [1.5, 2.0, 2.5]
  reduction measures: [61%, 82%, 91%]
  count: [2; 2; 2]
Going forward
Section last update: October 6th , 2020
There are ways we could use such model better. This could be put as part of an application that anyone could use to understand their behavioral risk. Moreover, we could have a system where we use phone Bluetooth as a proximity sensor (or user input) to find new close interaction with other users of the same system and use their potential contamination likelihood to get better estimates.
For now, those are just thoughts for after crossing half an ocean.


Comments by Mathieu Maender